Boiling Point Diagram (TXY Diagram)

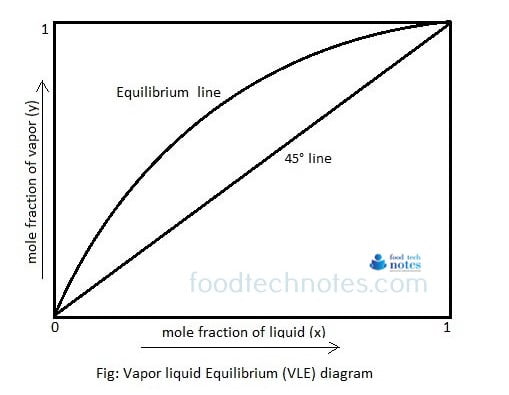
Equilibrium diagram (X-Y) diagram is simple diagram than boiling point diagram in which plot of temperature is eliminated. The boiling point diagram represents dynamic equilibrium of mole fraction of vapor and liquid phase at certain temperature at constant pressure. Boiling point diagram at constant pressure for binary mixture having component A and B is as below.

Read more

Types Of Mixtures (for distillation)

Miscible liquid mixtures are of three types which can be revealed by plotting the vapor pressure against mole fraction of component.

1. First type of mixture:

The Vapor pressure curve exhibit minimum area. If we take mixture which has excess of ‘x’ (more volatile compound), we are somewhere at ‘C’ on the curve. On distillation, vapor will contain excess of ‘x’ and thus the remaining mixture will get richer in ‘y’. Finally we reach the point ‘D’ where vapor pressure is minimum and thus the boiling point is maximum. Here the mixture will distill unchanged in composition. Read more